Machine Learning in Healthcare: Part 3 - Time for a Hands-On Test
 Bob HoytThis is the third article in a series of articles on the use of machine learning in healthcare by Bob Hoyt MD FACP. Parts 1 and 2 can be read here and here.
The recent medical literature is replete with risk calculators and a variety of models to predict disease, morbidity, and mortality. Traditionally, these models and risk calculators have been static and stored on websites or apps. We are now seeing real-time predictive analytics (using machine learning) that is integrated with the electronic health record (EHR).
For example, The University of Pittsburg Medical Center (UPMC), the nation’s largest non-profit academic health system, reported in March 2019 that the models they created using machine learning (ML) and data from their Cerner (inpatient) EHR helped decrease readmissions between days 7-30 by about 50%. These data are analyzed and entered into a dashboard (see figure) that is integrated into the clinical workflow so clinicians can take action. Their approach also includes geocoding so the system knows where patients live and where their referrals come from.
A second example of machine learning in healthcare comes from a study published in 2019 that used the same common machine learning algorithms mentioned in part 2 of this series to predict early neonatal sepsis, hours before it was recognized clinically.
 Figure 1 - UPMC dashboard
Every inpatient and outpatient EHR could theoretically be integrated with a machine learning platform to generate predictions, in order to alert clinicians about important events such as sepsis, pulmonary emboli, etc. This approach may become essential when genetic information is also included in the EHR which would mandate more advanced computation.
However, using machine learning and artificial intelligence (AI) in every EHR will be a significant undertaking because not only do subject matter experts and data scientists need to create and validate the models, they must be re-tested over time and tested in a variety of patient populations. Models could change over time and might not work well in every healthcare system. Moreover, the predictive performance must be clinically, and not just statistically significant, otherwise, they will be another source of “alert fatigue.”
The most common models will be based on classification and regression (supervised learning). Over time it is likely we will see clustering and association rules embedded as well. The table below summarizes supervised and unsupervised machine learning with examples of the more common algorithms.
In this article simple classification, regression, clustering, and the association will be presented using two of the free open source machine learning platforms.

Clearly, one of the educational challenges in data science is the fact that computer scientists often use terms different from those used by statisticians but mean the same thing. For example, a column = features = attributes = independent variables, whereas outcome = class = target = dependent variable. Once you can get used to the terminology, the approach gets much easier.
For our first example, we will select a validated dataset used to predict heart disease, based on cardiac catheterization results and we will use WEKA and RapidMiner as the machine learning software. In WEKA Explorer uploading a .csv file is straightforward, but you note that the user can also upload a file from a URL or from a database.
We will begin with the Preprocess tab. The figure below shows that a file “Heart_Disease_Prediction” has been uploaded and it has 270 instances (rows, patients) and 13 attributes (columns, features) with the class or outcome being heart disease, presence or absence.
 Figure 2 - WEKA Preprocess Tab
There are no missing data (unrealistic) and 120 people were found to have heart disease by cardiac catheterization and 150 did not. The class or outcome is nominal (categorical) and not numerical. The “Visualize All” button (lower right) shows the distribution of the 13 independent variables with those with heart disease present in blue, absent in red. (next figure) Skewed data and outliers can be easily visualized.
The first step in any data analysis is called exploratory data analysis (EDA) which really means “get to know your data” by visualizing the data to see if it is normally distributed, determining the types of data (nominal, ordinal, interval, ratio) and determining whether there are missing or skewed data.
On the main WEKA Explorer page, there is a tab “Visualize” that is different from the “visualize all” option and this creates a scatterplot of all variables so the user can look for positive or negative relationships between the variables. If the variables have vastly different scales (1-10) vs (1000-10000) then it would be wise to normalize or standardize the data by using a filter (option on the main Preprocess page).
Filters also allow you to convert numerical data into categorical data (discretize), e.g. ages to decades or “dummy code” categorical data into numerical data e.g. heart disease = 1, no heart disease = 0. Lastly, there is an option to handle missing data by imputation. In the EDA process, you always have to decide how you want to treat missing data. This is a more complicated subject and will not be discussed in this article.
 Figure 3 - Visualize All features
The second tab or "Classify" tab is where you will find the algorithms for classification and regression. Should you select the wrong algorithm, it will stay “grayed out” and non-functional. Selecting the "Choose" option reveals a large collection of algorithm choices. Users routinely run several algorithms (like recipes) to see what approach or model provides the best results. Each run only takes one second or less. Each algorithm can be further customized to see if the change affects the results but that will not be discussed in this introductory article.
A majority of the time, a model is built with machine learning based on training data and the eventual model is tested with the “test” data. For example, the dataset can be split into e.g. 70% training and 30% test data or if the dataset is small you can use the default “cross-validation” option (with 10 folds). The latter choice is the simpler route. If one looks at the model built as a recipe that you are tweaking, then the ultimate test is to have a stranger taste the end product. In machine learning that means you test your model on non-training data to see how close the results match yours. If the model works well on training data but not test data, then that is referred to as model “overfitting.”
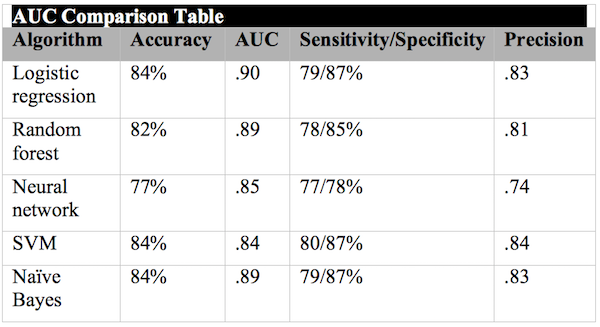
The classification results are very useful because they include: classification accuracy, precision (positive predictive value), recall (sensitivity), a confusion matrix and area under the curve (AUC). Most healthcare workers are used to seeing results, in terms of sensitivity and specificity. If the results of running multiple algorithms are similar, they can be compared in another WEKA option called "Experimenter" to determine if there is any statistical difference. Furthermore, there is a tab "Select attribute" which determines which attributes really contribute to the outcome.
In general, attributes that contribute less should be removed and the algorithm run again to see if it adversely affects the outcome. Simpler models are better! For example, “Select attributes” determined that the thallium results, followed by chest pain type, followed by the number of calcified vessels on fluoroscopy were the top three attributes predicting heart disease. Cholesterol, blood pressure and fasting blood sugar over 120 did not appear to contribute as much to the model and therefore should probably be removed. The table below displays the results of running 5 common classification algorithms. Logistic regression had the best AUC level, but others were very close. A good AUC result is greater than 80.
I analyzed the same dataset with RapidMiner, using the Auto Model option. The algorithms selected were Naïve Bayes, logistic regression, deep learning, decision tree, random forest, and SVM. Naïve Bayes demonstrated the highest AUC of .94. The figure below shows the AUC results in orange for all of the algorithms run.
Sensitivity/Specificity = 90.6/91.6%. RapidMiner also generates relative weights of the variables. After deleting the six lowest weighted variables, I re-ran classification and the AUC for Naïve Bayes was .927, indicating that we could simplify our model without losing significant performance.
 Figure 4 - AUC comparison using RapidMiner
For regression in WEKA, users would select the "Classify" tab, then functions folder and choose linear regression. As stated, other algorithms can also perform regression. As an example, using a classic low birth weight study dataset, where the outcome was birth weight in grams (numerical) linear regression showed that the variables selected did not correlate or predict birth weight very well.
For a cluster analysis in WEKA users would select the “Cluster” tab and the default algorithm is EM (expectation maximization) which automatically selects the number of clusters based on class probabilities. The result on the heart disease prediction dataset was 4 clusters were identified. For other algorithms, such as k-means the user must experiment by selecting various cluster sizes and looking at the results. By right-clicking the results, the user can see a visual graph of the clusters.
It should be noted that cluster analysis is difficult and frequently requires expertise in interpretation. When the dataset was analyzed with clustering in RapidMiner, two cohorts were identified. In cluster 0 there were 113 patients characterized as positive for exercise angina, most with heart disease and most with multiple calcified coronary arteries on fluoroscopy. Cluster 1 consisted of 157 patients and was characterized as the opposite of cluster 0. See figure below:
 Figure 5 - AUC comparison with RapidMiner
Association algorithms create rules between variables that may be unknown and unlike classification, may have little to do with the outcome variable. Association rules can be generated only on nominal data, so the filter “discretize” is first selected and applied to all attributes. Secondly, an association is dependent on “support” and “confidence” levels. Support is how frequently the variables of interest occur in the dataset. Confidence is the probability that if you have X you also have Y (or prediction accuracy). First, select the “Associate” tab. Be sure the algorithm chosen is “Apriori.” Ten rules are published and the first is the following:
Sex='(-inf-0.1]' Heart Disease=Absence 67 ==> Thallium='(-inf-3.4]' 65 <conf:(0.97)>
The rule is saying if you are female (-inf-0.1) and you have no heart disease (67 cases) the probability of the thallium test rated normal (-inf-3.4) was 65 of 67 cases or accuracy of 97%. (-inf = infinity). Similar results were found with RapidMiner.
Summary: I encourage healthcare workers who are involved with data analytics to become familiar with one of the machine learning programs, as I believe they will find the programs useful and not that difficult to learn and use. However, this will not make you an expert in machine learning, but it will be a good start. A basic understanding of biostatistics is necessary for predictive modeling and interpretation. Also, many experts have opined that about 80% of time spent on data projects involves cleaning and preparing the data for analysis, so spreadsheet skills are also important.
The video tutorials for the machine learning platforms are very good and an excellent starting point. There are enough sample datasets with each program to get comfortable with explorative data analysis and predictive modeling.
Hopefully, this short dataset demonstration has given you examples of how machine learning works. In addition, we hope that you now know of several machine learning programs worth learning and adopting.
- Tags:
- artificial intelligence (AI)
- biostatistics
- Bob Hoyt
- Cerner EHR
- clinical workflow
- data scientists
- data visualization
- Electronic Health Record (EHR)
- exploratory data analysis (EDA)
- geocoding
- healthcare
- machine learning (ML)
- machine learning software
- open source machine learning platforms
- RapidMiner
- real-time predictive analytics
- risk calculators
- University of Pittsburg Medical Center (UPMC)
- Weka
- Login to post comments